Showing posts with label java. Show all posts

Sunday, November 17, 2019

Java Performance Tools: 9 Types of Tools You Need to Know!

Java Performance Tools: 9 Types of Tools You Need to Know
Managing an application’s performance, and specifically keeping it in good condition, is one of the hardest challenges in software development. That’s true for virtually any programming language and platform.
Java is no exception to this rule. But beyond that, Java also presents some unique challenges of its own.
For instance, one of those challenges has to do with garbage collection. Java features automatic memory management, which frees the developer from having to manually dispose of obsolete objects.

But you know what they say about free lunches. Garbage collection has a cost: too many collections will take its toll on performance.
Garbage collection apart, keeping track of a Java application’s performance is an ongoing task, so it is important to have the right tools. 
And that’s what today’s post is all about. We’re going to cover nine Java performance tools. Or rather, nine types of performance tools.
After learning about these broads categories, you’ll be able to analyze your particular scenario and decide the right type of tool to suits your needs. Let’s get started.

1. Java Profilers

JVM Profiles offer a ton of raw data by tracking all method calls, allowing you to find CPU and memory consumption hotspots.
A good scaling test is to set up an Apache JMeter job to hit an endpoint you are developing a few thousand times while linked to a profiler. This allows you to spec out memory and CPU requirements for production.
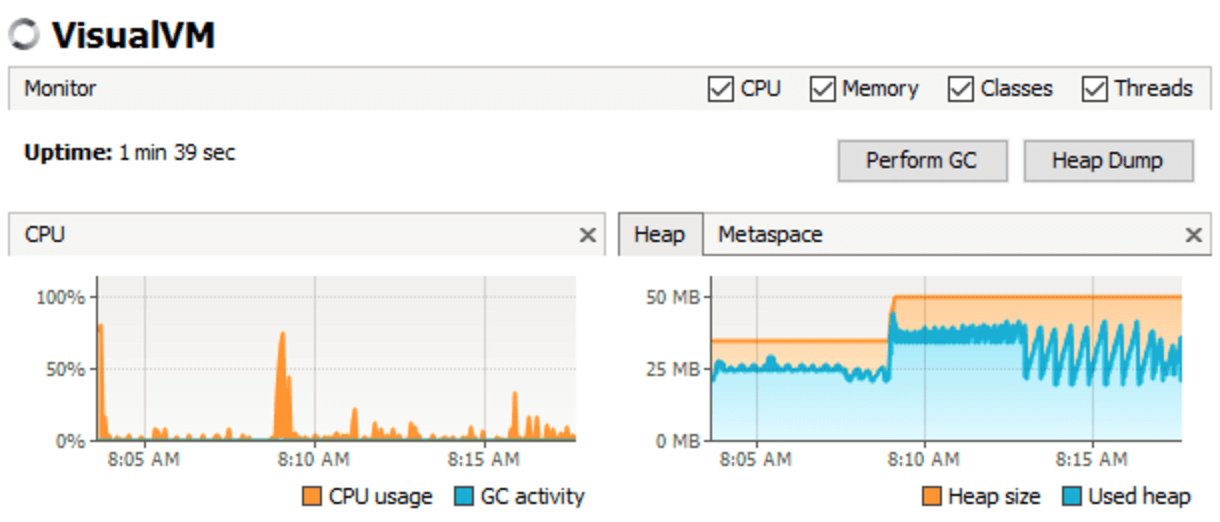
java performance tools visualvm
Screenshot of VisualVM CPU and Heap Size
Pros: Great for tracking down memory leaks; the ability to manually run garbage collection and then review memory consumption can easily shine a spotlight on classes and processes that are holding on to memory in error.
Cons: Requires a direct connection to the monitored JVM; this ends up limiting usage to development environments in most cases. (Note: some profilers can work off thread and memory dumps in a limited fashion.)
Popular Tools: VisualVMJProfilerYourKit and Java Mission Control.

2. Tracing Java Web Requests and Transactions

Standard profilers are focused on the performance of all methods across the entire application. These tools are focused on the performance of individual web requests or transactions.
Prefix provides deep level performance details about your app, including ORM calls with generated SQL, SOAP/REST API calls, and trace details from the most commonly used third-party libraries and frameworks.
XRebel is set up using a Java Agent on your web application’s container and provides an overlay on your application that gives details about the current request.
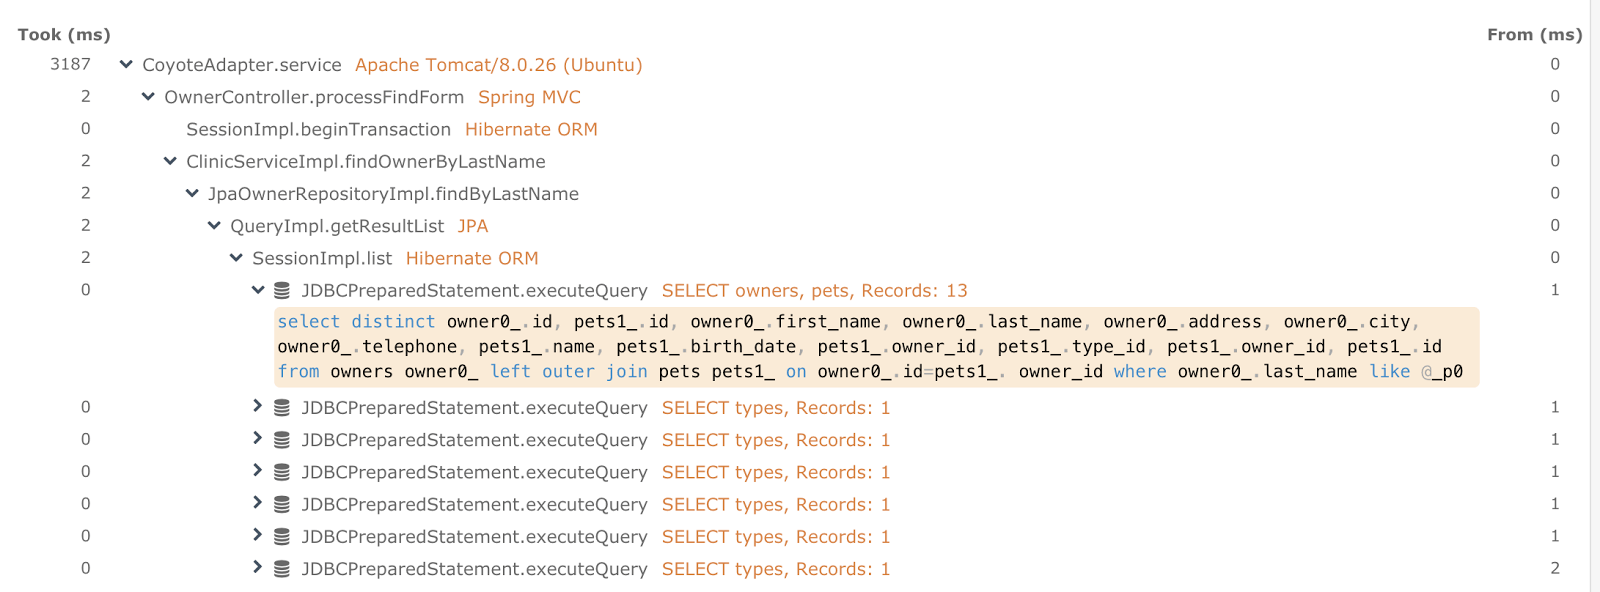
Tools like Prefix can provide very detailed traces of what your code is doing:
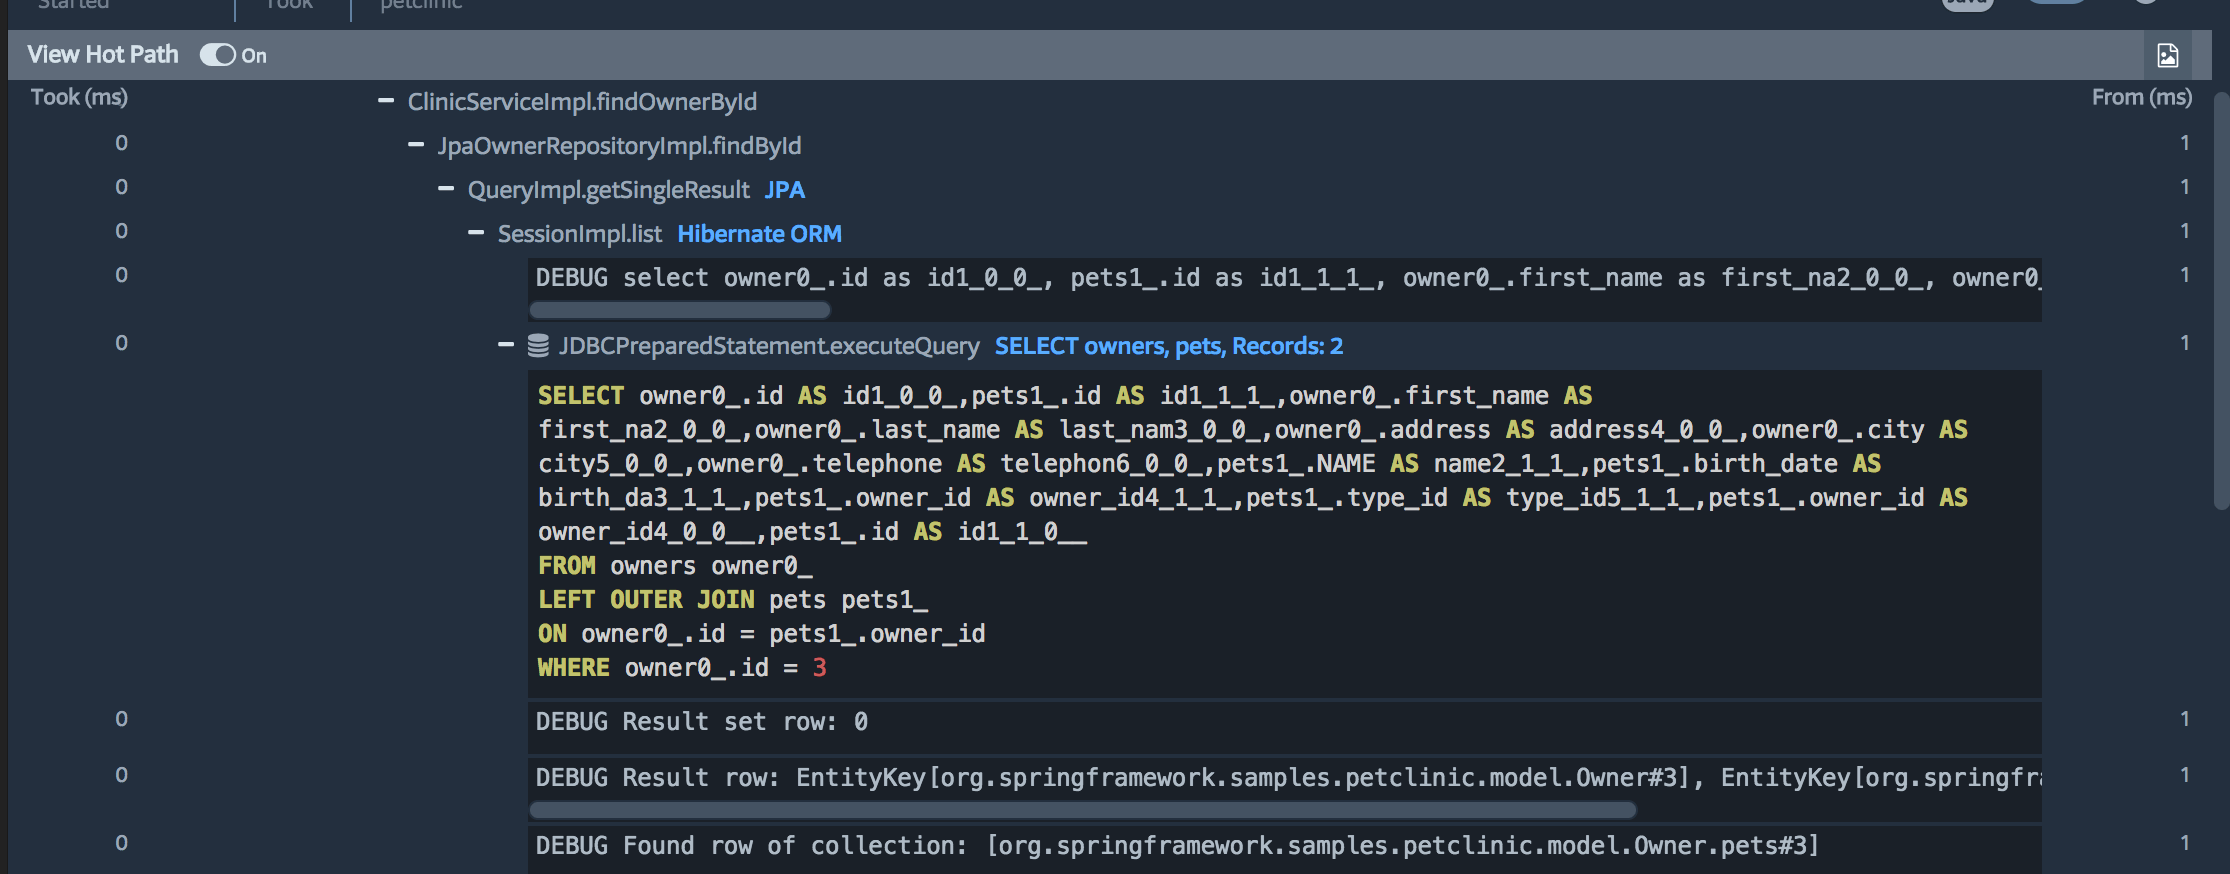
Prefix web request performance trace
Screenshot of Prefix web request trace
Pros: These tools give order to the vast amount of data available in a JVM profiler. By helping you follow the flow of a request, you can see what types of method calls are responsible for your response time.
Cons: Designed for the development cycle only. QA and Production environments will require an APM solution.

3. Java Application Performance Management (APM)
Application performance management (APM) tools take on the task of tracking all requests on a production system.
The trick with these profilers is to provide the right information smartly so as not to impact production performance.
This is done by aggregating timing statistics and sampling traces. This gives you method-level visibility to your code that is running in production.
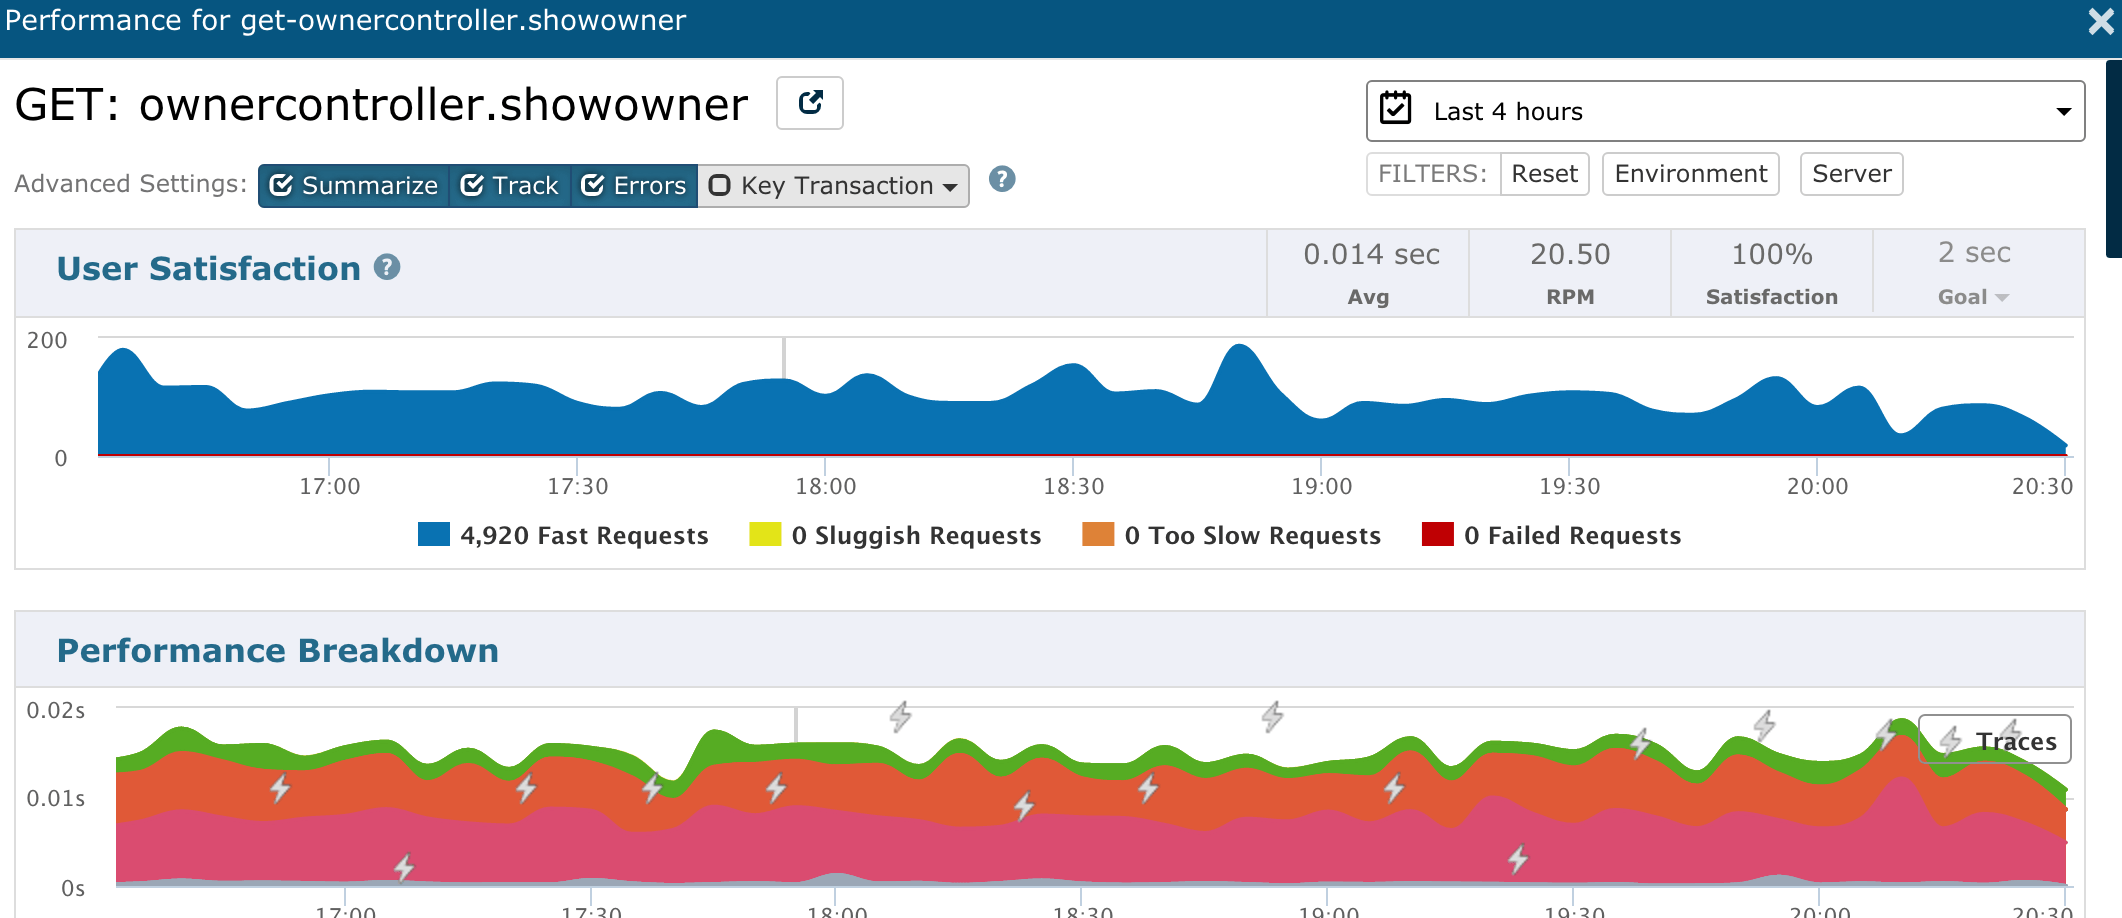
Retrace Action Overview for Java
Screenshot: Retrace Action Overview
Pros: The ability to monitor your most critical environment: Production. Identify issues before going into production by monitoring QA/Staging. Debug production lives by analyzing traces and exceptions. Aggregate summaries to see highly used requests to help focus development time.
Cons: Typically expensive to run on all QA/Staging and Production servers. Some tools lack support for async queries or are not tuned properly and slow down your application.
Popular Tools: New Relic, Microsoft, Stackify, AppDynamics, Dynatrace, and others
Note: Some providers, including Stackify, provide free trials that can be used to help identify immediate problems.

Compare Retrace & New Relic
Compare Retrace & App Insights

See Exactly What Retrace Can Do - Calculate ROI

4. Real User Monitoring (RUM)

It’s not uncommon for web apps to be very client-side heavy. Therefore, providing an interactive experience can require a good deal of dependencies, such as Javascript/CSS frameworks, web fonts and images.
RUM provides insight into your application’s dependencies by giving visibility to asset download and page rendering time.
Some APM products include this as an additional feature. There are also standalone products, such as Google PageSpeed.
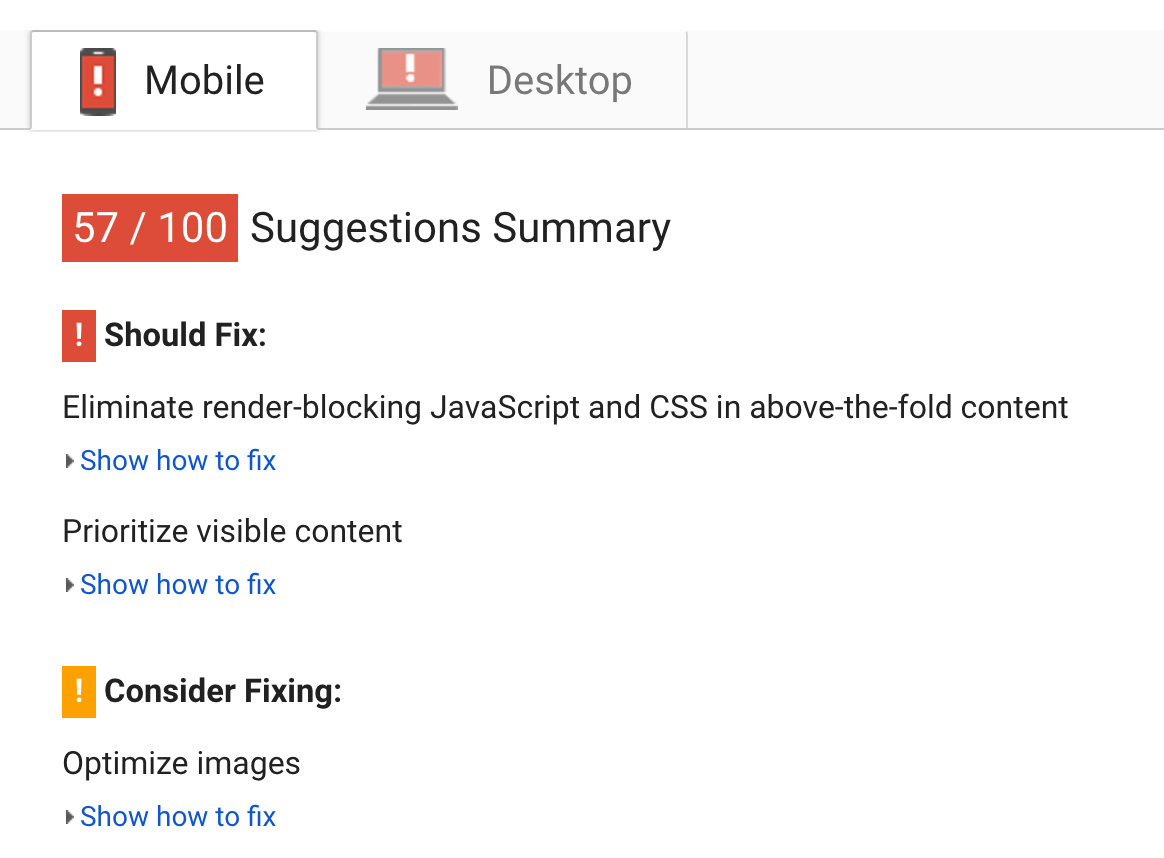
Google PageSpeed Overview
Screenshot: Google PageSpeed Overview

5. JVM Performance Metrics

The JVM provides a great deal of valuable information such as garbage collection, memory usage, and thread counts. This data is made available via JMX.
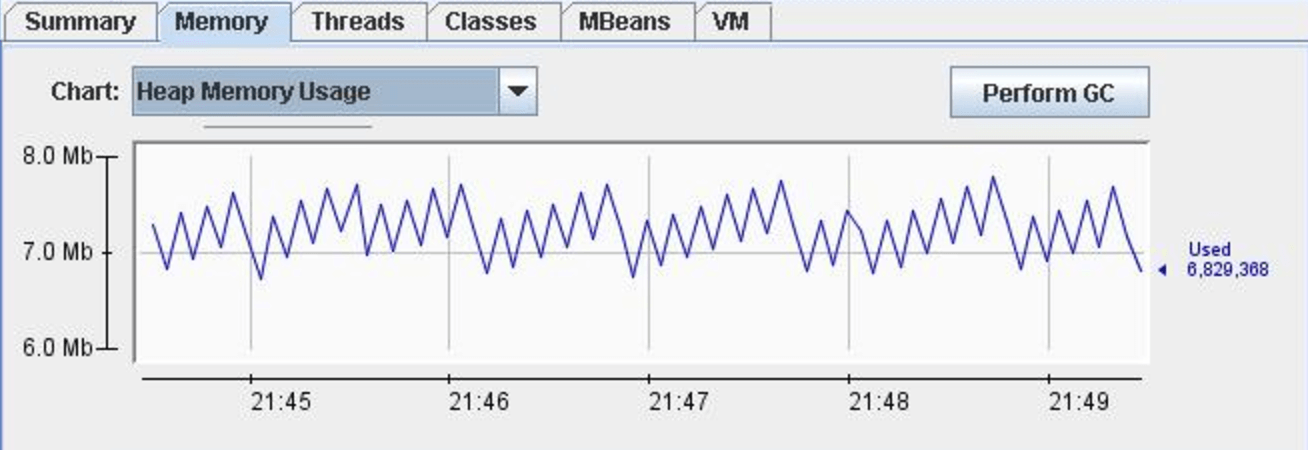
JConsole Monitoring Heap Memory Usage
Screenshot: JConsole Monitoring Heap Memory Usage
Stackify Retrace provides JVM metric monitoring via App Monitors and automatically applies smart defaults based on the type of application discovered.
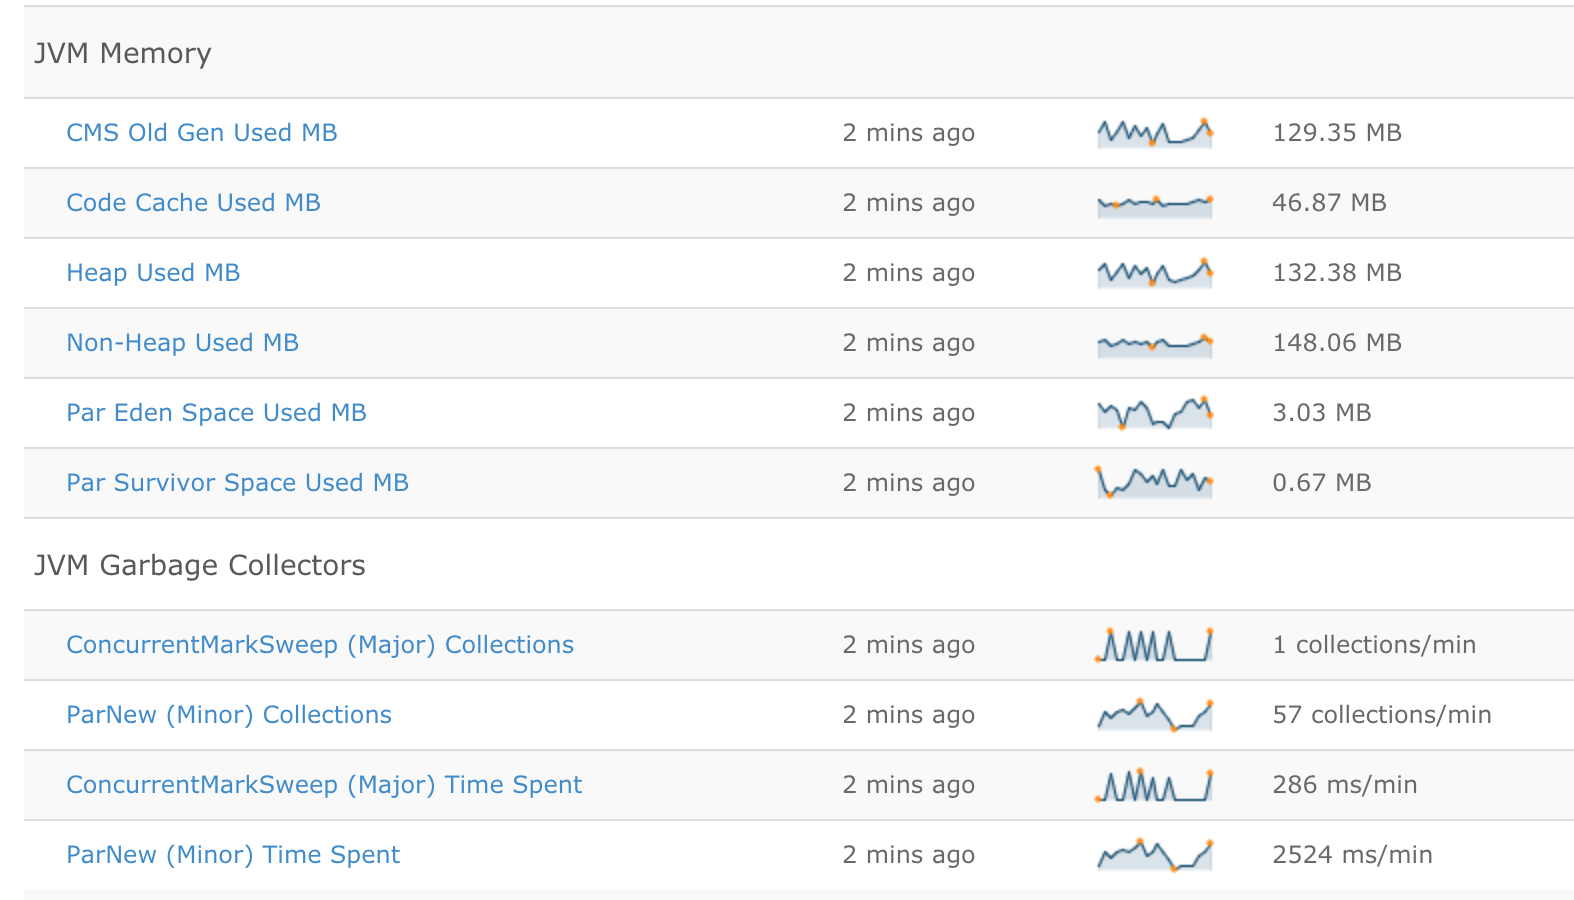
Stackify JVM smart default monitors
Screenshot of Stackify JVM smart default monitors
Screenshot of Stackify Retrace JVM metric dashboard
Pros: Available in any application running on the JVM and easy to connect to with apps such as JConsole.
Cons: Can be difficult to connect to in a staging and production environment. Aggregation and comparing data might be time-consuming. Stats are only gathered while the monitor is connected to the JVM.

6. Web Server (Apache/Nginx) Access Logs

If you have Apache or Nginx proxying requests to your Java application server, you can monitor access logs. This is a quick way to see how long requests are taking.
You can aggregate the access logs to see what the most popular/fastest/slowest endpoints are. Doing this via the command line can be time-consuming, though.
For small datasets, you can use a desktop tool like Apache Viewer, but for staging and production environments, a hosted logging solution is ideal.
Tracking Failed Requests is also very useful, which can be done by aggregating on HTTP Response Codes.
Pros: Quick way to get some simple stats by tailing access logs, or—if more info is needed—push into a log analyzer.
Cons: Doesn’t give you any details as to why the request took as long as it did. Lack of POST data and response content that could help point you to the cause of a performance issue.
Desktop Tools: AWStats and Apache Viewer
Hosted Tools: ELK stackStackifySplunkLogEntries

7. Tracking All Java Exceptions

One of the biggest causes of performance problems can be application exceptions.
When an exception is thrown, it causes the thread to pause while the stack trace is collected. Even handled exceptions that seem innocent can cause huge performance bottlenecks under heavy server load.
It is important to aggregate and monitor all of your exceptions to find critical problems, new errors, and monitor error rates over time.
Pros: Easy to set up if you are using a logging framework such as Log4j or Logback.
Cons: None
Popular Tools: APM providers, Raygun, Stackify

8. Monitoring Java Exceptions

When trying to improve an app’s performance, you often need not simulate requests from users, but to instead monitor its actual operation.
By monitoring JavaEE Servers in both production and QA environments, you become able to make decisions based on trends, before problems become too severe.
You could also find out the causes of response times, implementing optimizations based on such times.
How To Handle Java Exceptions
JavaMelody is an example of a tool that can help you perform environmental monitoring.

9. Memory Analysis

Application memory analysis after a crash can help with identifying the cause of a memory leak. You can instruct the JVM to dump the heap on an OutOfMemoryError exception by adding the following argument to the JVM:
-XX:+HeapDumpOnOutOfMemoryError
The heap dump file can be loaded into an analyzer: Eclipse MAT. You can dive into the Overview or Leaks Suspects reports to help identify the cause of the memory exception.
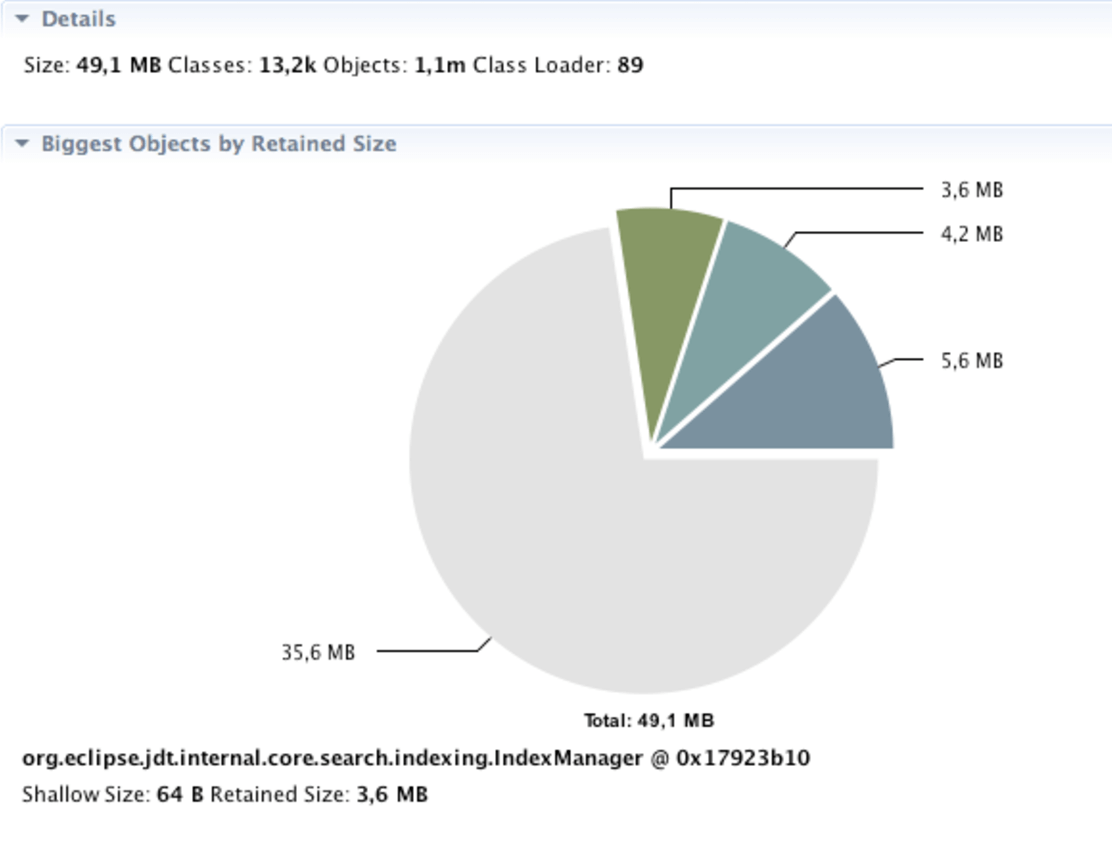
Eclipse MAT: Biggest Objects by Retained Size
Screenshot of Eclipse MAT: Biggest Objects by Retained Size

Boost Your Application’s Performance

The big takeaway is that making and keeping your Java application performance is easier than ever with all these tools.
Don’t be overwhelmed by all the things you should be doing. Start with the low hanging fruit first, like exception tracking.
It is really good to at least know what options are available to you, and I hope you found this list helpful.

Functional Programming vs. Object Oriented Programming


In current development, Object Oriented Programming has proven more popular than its predecessor Functional Programming.  Functional Programming was developed before Object-Oriented Programming, with support for Lisp, Clojure, Wolfram, Erlang, Haskel, F#, and R.  Object Oriented Programming is more modern with support for C++, C#JavaPythonRubyPHP, Perl, Objective-C, Swift, and Dart.  With the increasing popularity of JavaScript, Functional Programming is experiencing a resurgence in popularity.

Definition

Functional Programming treats programs as functions and is assigned using a mix of recursions. Object-Oriented Programming is a convolution of cooperating objects. Every object inside the program can receive a message, process data, or send messages to other objects. In Functional Programming, the function is the primary unit that can be changed. In Object-Oriented Programming, the object is the primary unit that can be changed.

Method

With Object-Oriented Programming, everything is imperatively described with the code describing how the program works. The commands go through the machine, statements are executed and then appear in the right order. If the order is not right, the program will not run.
Functional Programming utilizes more flexible declarative programming. In Object-Oriented Programming, the command words would be: “You must do this” and the program would run smoothly. In functional programming, you could tell the program: “You should do this” without further specifications, and the program would run without any issues.

Data

Functional Programming is a more “flexible” approach, with mutable objects. These objects can be changed, even after they have been created. In contrast, Object-Oriented Programming uses immutable objects that cannot be altered.  
While Functional Programming and Object-Oriented Programming use mutable and immutable objects, they do have a type. Mutable fields can be changed after object creation and have a method for modifying the field value. Immutable objects cannot be changed after object creation and method for modifying the field value does not exist.

Drawing a parallel

Parallel Programming is defined as the calculations or the execution of processes carried out simultaneously.  Functional Programming supports Parallel Programming, while Object-Oriented Programming does not.
Parallel Programming is a separate branch of programming where special methods are used to separate algorithms into their basic parts.  The methods are performed on several machines or CPUs at the same time. Hence the term, parallel.
By using Parallel Programming, computing time is significantly reduced with quicker results compared to that of Non-Parallel Programming. Although, at times, Parallel Programming is not always the most time-efficient programming method and a different method is needed. 

Paradigm

The programming paradigm is the execution or “philosophy” of certain programming languages.  With this, the programming languages have been separated into two basic groups: imperative languages and declarative languages.
The basic divisions are further broken down into Structural or Classic “Imperative” Programming, Logical Programming, Functional Programming, and Object-Oriented Programming.
Structural Programming is often thought of as the introduction into programming as it commands your machine through branching and cycles.  Logical Programming is most often used in artificial intelligence development with problems explained in detail. Functional programming is defined as a function.  Object-Oriented Programming interprets real-world issues and situations and is the most popular programming method in current development.  

Iteration

Iteration serves as an additional difference between distinctive between Functional Programming and Object-Oriented Programming. Iteration can best be defined as something that is repeated several times, to get close to the same result or goal. 
Every kind of repetition in programming is called iteration. More specifically, the repetition of command blocks. When one iteration ends, the results from it are used as a starting point for the next iteration, and so on.
Below is an example of an iteration:
a = 0
for i from 1 to 3        // goes through the loop 3 times
{
  a = a + i              // current value sized up for i
}
print a 
Functional programming uses recursion for iterative data, whereas Object-Oriented Programming uses loops. Recursion is an infinite, scaling repetition of the same pattern – ascending or descending. The method in the program will be called each time the program is executed.
Iterations (loops) are the instructions in a program that are executed over and over again. Iterations are always applied to a set of certain instructions while recursions are always related to a method.
If a  recursion does not have a brake or condition, it will result in blocking the computer by using all of its resources. In contrast, if a variable is not terminated, the iteration will last indefinitely. Functional Programming tends to be more compact than Object-Oriented Programming with recursions making code a bit shorter and iterations making it longer. 

Use

There are no definitive rulings for when to use Functional Programming and when to use Object-Oriented Programming.  At times, Object-Oriented Programming is not the cleanest way to program. To reach a perfect solution, software developers can over-engineer their code.  Functional Programming can prove difficult for junior developers to understand and execute.  
Object-Oriented Programming and Functional Programming are not mutually exclusive.  Popular programming languages, such as Swift and Scala, mix the two programming methodologies. 

The resurgence of Functional Programming with Popularity of JavaScript

Functional Programming has made it’s a big comeback with the popularity of JavaScript and its component-based pattern libraries, such as Angular, Vue and React.  React, for example, has a functional-based design and the objects in it are immutable. 
JavaScript has first-class functions and can be passed like any other values. That means that a function can be passed to another function, which makes higher-order functions. They are mostly used to abstract actions, async flow control, and create utilities.

Conclusion

With differences in their definitions, methods, and uses, Object-Oriented Programming is more popular in current development than its precursor Functional Programming.  But, Functional Programming is experiencing a resurgence with the increasing popularity of JavaScript and languages such as Swift and Scala combining the two programming methodologies.

Here’s How to Calculate Elapsed Time in Java

Many things in programming sound like they should be easy, but are quite hard. Calculating elapsed time in Java is one of those. How hard could that be? As it turns out, it can be tricky.
For starters, we have the fact that time itself is a tricky concept. For a quick example, remember that many places around the world observe Daylight Savings Time. Failing to take DST into account when you should, can and often does result in incorrect calculations.
black and white photography of alarm clock displaying 1:37 time
Then, we have the problem that, in Java, there are many ways of performing this calculation. You have different alternatives brought to you by the Java API itself—and don’t forget that Java 8 brought us an entirely new date and time API, based on the popular Joda-time open-source project. Additionally, third-party libraries add their own options to the mix.
In this post, we’ll offer some guidance so you can decide the most appropriate option to use when calculating elapsed time in Java. We’ll start by covering the different types of elapsed time calculation one might need to perform. Then we’ll quickly turn our focus to the alternatives themselves, explaining the strengths and weaknesses of each one. By the end of the post, you’ll be aware of the main ways in which you can perform this calculation, and you’ll be able to make an informed decision about the best alternative for your scenario. Let’s begin!

Java Elapsed Time Calculation: Not a Single Thing

There are several different ways of calculating elapsed time in Java. To make the right call for your scenario, there are several factors you must consider. One of them refers to the type of elapsed time calculation.
When it comes to the motivations behind calculating elapsed time, we can broadly categorize them into two main groups. The first category is what I call the “business logic” motivation. This is when you have to calculate the elapsed time of some event that is relevant to your application’s core business or domain. A good example would be recording the time a worker clocks in and out and then calculating the amount of time worked.
The second category is what I like to call “meta” motivation. This means calculating elapsed time for some reason that’s not related to the domain of your application, but rather, refers to some concern about the development itself. The classic example here would be benchmarking a function for performance measurement purposes.
Why is this distinction important? For now, understand that it’s going to be crucial to decide which one of several options is the right one to calculate elapsed time. We’ll cover that in more detail in the sections to come.

Calculating Elapsed Time in Java in All Shapes and Sizes

Without further ado, let’s now cover some of the main ways to perform a calculation of elapsed time in Java.

The Quick, Easy, and Often Incorrect Way: System.currentTimeMillis()

We start our list of ways to measure elapsed time in Java with a solution that’s easy but often incorrect. First, we’ll show a quick example of how to perform the calculation, and after that, we’ll explain the code:
long start = System.currentTimeMillis();
// some time passes
long end = System.currentTimeMillis();
long elapsedTime = end - start;
In the example above, we’re using the “System.currentTimeMillis()” static method. The method returns a long value, which refers to the number of milliseconds since January 1st, 1970, in UTC. So, why is this solution problematic?
The results you get from the difference may be inaccurate because the method measures what we call “wall-clock time.” That means it can change for a variety of reasons, including changes in the system clock or even leap-seconds.
So, in short, you should avoid using the currentTimeMillis() method for calculating elapsed time if you need high precision.

The Also Quick, Also Easy and More Likely to Be Correct Way: System.nanoTime()

Let’s now see another way of calculating elapsed time. We’ll first notice the example and then comment on it.
 long start = System.nanoTime();
 // some time passes
 long end = System.nanoTime();
 long elapsedTime = end - start; 
As you can see, the code looks a lot like the code in the previous example. The only difference is that now we’re using the “nanoTime()” method instead of “currentTimeMillis().” So, what’s the difference between the two methods?
The first notable difference is that “nanoTime(),” as its name suggests, returns its result in nanoseconds. Per the documentation, we can see that the source of its return value is the high-resolution time source of the JVM (Java Virtual Machine.)
The documentation also stresses some other important facts. The first of them is that you can only use this method to calculate elapsed time. In other words, the value returned by the method isn’t meaningful, since it has no relation to any time system.
Another important thing to bear in mind when using this method is that, while it provides nanosecond precision, it doesn’t necessarily offer nanosecond resolution. “Resolution” here means the frequency with which the value is updated.
Finally, bear in mind that the method isn’t thread-safe.
stop watch at 15

The StopWatch Class

We’ll now turn our focus to libraries, by covering the StopWatch class provided by the Apache Commons Lang API. Let’s see a quick example:
 StopWatch watch = new StopWatch();
 watch.start();
 // call to the methods you want to benchmark
 watch.stop();
 long result = watch.getTime(); 
As you can see from the code above, the usage of the StopWatch is very simple. You start the timing by calling the “start()” method. Then you do whatever tasks you need to perform. After that, you’re ready to call “stop()” and then “getTime()” which will return the elapsed time in milliseconds. Keep in mind that this class presents temporal coupling. That means you can’t, for instance, stop a clock that you haven’t started or started a clock that is already running. Attempting to do so will result in an exception being thrown.

Post-Java 8 Alternatives

Java 8 brought us the new java. time API, which introduced several new types representing important time concepts. You’ll now see how to calculate elapsed time using two of the new java.time types: the Instant and the Duration classes. Take a look at the following example:
 Instant start = Instant.now();
 // time passes      
 Instant end = Instant.now();
 Duration timeElapsed = Duration.between(start, end); 
The first new thing we notice is the Instant class, which is immutable and thread-safe. This new type represents a single, instantaneous point in the timeline, and, as such, you can use it to calculate elapsed time. But to do that, we’d need a new class yet, and that’s where Duration comes in to help.
Duration, like Instant, is an immutable and thread-safe class. According to the documentation, it represents an amount of time that is time-based, such as “4 hours” or “36 seconds.”
By calling the “between” method and providing it two instances of the Instant class, we’re able to calculate a duration. Afterwards, you can use one of the Duration’s methods—such as “today's(),” “toHours(),” “toMinutes(),” and so on—to convert the duration to the unit that’s more appropriate for your needs.

Learn About Time. It’s About Time!

In this post, we’ve covered some of the main alternatives for calculating elapsed time in Java. As you can see, some alternatives cater to different needs. If you need the highest possible precision, you won’t be using “currentTimeMillis(),” for instance. On the other hand, if you need thread-safety, you can discard “nanoTime().”
Also, keep in mind that we haven’t presented all of the possible alternatives to perform this calculation. For instance, we didn’t mention this other StopWatch class that is provided by the Guava API.

Java Profilers: Why You Need These 3 Different Types


Debugging performance issues in production can be a pain and, in some cases, impossible without the right tools. Java profilers have been around forever, but the profilers most developers think about are only one type: standard JVM profilers.
However, using one type of profiler is not enough.
Suppose you’re analyzing your application’s performance. There are multiple profiling activities which you may execute. Generally, standard profilers handle memory profiling, CPU profiling, and thread profiling.
But even with all this coverage, by using a combination of multiple profilers, you’ll find more performance issues. This is because each profiler is better in a certain aspect for chasing a performance bug.

Stackify Bug Finder
In this post, we’ll discuss about the three types of Java profilers and why we need all of them while developing the application. We’ll start with the types and dive deep into each of them.
Let’s take a look into the three different kinds of Java profilers:
  1. Standard JVM profilers that track every detail of the JVM (CPU, thread, memory, garbage collection, etc).
  2. Lightweight profilers that highlight your application with a bit of abstraction.
  3. Application performance management (APM) tools used for monitoring applications live in production environments.

Standard JVM Profilers

Products like VisualVMJProfilerYourKit and Java Mission Control.
A standard Java profiler certainly provides the most data, but not necessarily the most useful information. This depends on the type of debugging task.
These profilers will track all method calls and memory usage. This allows a developer to dive into the call structure at whatever angle they choose.
Pros:
  • Great for tracking down memory leaks, standard profilers detail out all memory usage by the JVM and which classes/objects are responsible.  The ability to manually run garbage collection and then review memory consumption can easily shine a spotlight on classes and processes that are holding on to memory in error.
  • Good for tracking CPU usage, a Java profiler usually provides a CPU sampling feature to track and aggregate CPU time by class and method to help zero in on hot spots.
Cons:
  • Requires a direct connection to the monitored JVM; this ends up limiting usage to development environments in most cases. (Note: some profilers can work off thread and memory dumps in a limited fashion.)
  • They slow down your application; a good deal of processing power is required for the high level of detail provided.

Lightweight Java Transaction Profilers

Products like XRebel and Stackify Prefix.
Lightweight profilers take a different approach at tracking your application by injecting themselves right into the code.
  • Aspect Profilers use aspect-oriented programming (AOP) to inject code into the start and end of specified methods. The injected code can start a timer and then report the elapsed time when the method finishes. These profilers are simple to set up but you need to know what to profile. For an example, see Spring AOP Method Profiling.
  • Java Agent profilers use the Java Instrumentation API to inject code into your application. This method has greater access to your application since the code is being rewritten at the bytecode level. This allows for any code running in your application to be instrumented—be it code you wrote or 3rd-party libraries your application depends on. Check out Introduction to Java Agents to see how this all works.
Aspect profilers are pretty easy to set up, but they are limited in what they can monitor and are encumbered by detailing out everything you want to be tracked.  Java Agents have a big advantage in their tracking depth but are much more complicated to write.
Stackify Prefix is a developer-oriented Java profiler using the Java Agent profiler method behind the scenes.
The cool thing is that Prefix already knows the most desired classes and 3rd party libraries developers want to be instrumented—so you don’t have to detail them all out. Plus, it takes all the stats from the instrumentation and displays them in simple and understandable manner.
As an example, when running an application using Hibernate, Prefix will not only detail out the elapsed time for queries but also displays parameter values for the generated SQL. When your app calls to a SOAP/REST API, Prefix provides the request and response content.

Java profiler prefix example
Prefix Screenshot: Tomcat Web Request Trace


See Exactly What Retrace Can Do - Calculate ROI

Low Overhead, Java JVM Profiling in Production (APM)

APM tools like New Relic, AppDynamics, Stackify Retrace, Dynatrace.
All the profilers so far have been great for development, but tracking how your system performs in production is critical.
Production is always a different landscape—development and staging setups typically don’t have the same datasets and load.
Java APM tools typically use the Java Agent profiler method but with different instrumentation rules to allow them to run without affecting performance in productions. The trick with these profilers is to provide the right information in a smart way to not take up CPU cycles.


Stackify’s Retrace is an APM tool that uses the same tech as Stackify Prefix with a few adjustments to run smoothly in staging and production environments.
This is done by aggregating timing statistics and sampling traces. This gives you method-level visibility to your application’s code that is running in production.
So when you have a slow web request, that will translate into a trace showing up in Retrace. From there you can dive in and see what methods are the culprit.

java profiler performance aggregation

Retrace Screenshot: Web Request Aggregation over 4 hours

java profiling tomcat trace
Retrace Screenshot: Tomcat Web Request Trace

Why Do You Need All 3 Profilers for Your Application?

Standard profilers are good at finding performance issues in the development stage. But production is a different scenario. Your app’s behavior may change based on incoming traffic, server request, response, and many other things.


So, what is the solution to the production environment? APM tools are the answer. APM tools target the production environment and provide a report regarding your app’s performance.
So, standard profilers help in development and APM tools help in production. You may be wondering what the need is for lightweight transaction profilers.
Well, lightweight profilers follow a different approach to code profiling. They inject themselves directly in the code—especially at the start and end of a method.
They’re also easy to set up and consume relatively fewer resources. This is highly useful for applications that use hardware transaction memory. Those applications demand refined analysis tools that point out exactly which method or function is causing performance issues.
Undoubtedly, we can say that if you’re developing a complex application, you’ll need all three profilers. Each profiler type has a unique approach checking an application for performance issues.
RebelLab’s survey also showed that most companies use multiple code profilers for finding performance issues in their application.

Why Are Some Java Profilers So Expensive?

XRebel is a cool tool, but it costs $365 a year. Stackify Prefix is free and provides much of the same functionality.
The biggest problem with APM solutions is definitely their pricing. They have traditionally been so expensive that only the largest enterprises could afford them.


It doesn’t make a lot of sense to spend approximately $100 a month on a server at Azure or AWS and then spend almost $200 a month for a product like New Relic.
Monitoring tools shouldn’t cost more than the servers!

Wrapping It Up

Now that you have learned about the three types of Java code profilers, it’s time to decide whether you really need all of them.
The answer lies in your application’s nature.
If it’s small like a local business or shop’s expense management system, profiling is very simple. A standard profiler will do the job.
If you are developing a web application like a courier facility’s tracking system, your application may be accessed by thousands of users. In that case, you will also need APM tools for the production environment.
Finally, if your application is for embedded systems, you will need all three of them.
Choose well, and have fun developing an application that delivers optimum performance.